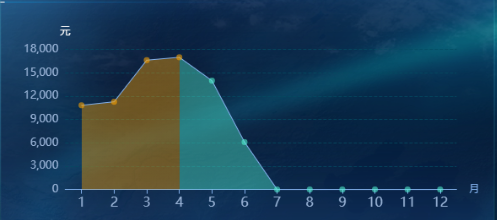
效果图:

visualMap:
min和max:设置数据映射的最小值和最大值。inRange:定义一个映射的范围,可以设置颜色、大小等属性。outOfRange:定义超出范围的映射属性。orient:设置组件的方向,可以是 ‘horizontal’ 或 ‘vertical’。left、right、top、bottom:设置组件的位置。splitNumber:设置分段型visualMap的分段数。pieces:设置分段型visualMap的各段范围和样式。
fetColumnData = (dataX, dataY, unit) => {
    const chart = echarts.init(this.chartRef.current);
    const color = ['rgb(39, 42, 233)', 'rgb(15, 216, 206)']
    const color1 = [
        'rgba(83, 246, 211, 0.57)',
        'rgba(255, 165, 0, 0.57)',
        'rgba(92, 222, 109, 0.57)',
        'rgba(0, 255, 0, 0.57)',
        'rgba(255, 0, 0, 0.57)',
        'rgba(66, 168,  218, 0.57)',
        'rgba(240, 106, 106, 0.57)',
        'rgba(230, 122, 240, 0.57)',
        'rgba(255, 255, 0, 0.57)',
        'rgba(0, 0, 255, 0.57)'
    ]
    let pieces = [];
    for (let i = 1; i < dataY.length; i++) {
        let startColor = color1[0];
        if (dataY[i] > dataY[i - 1]) {
            startColor = color1[1];
        }
        pieces.push({
            gte: i - 1,
            lte: i,
            color: startColor
        });
    }
    var hasDataOption = {
        backgroundColor: 'rgba(20, 58, 110,0)',
        color: ['#3cefff'],
        grid: {
            top: '20%',
            bottom: '3%',
            left: '3%',
            right: '5%',
            containLabel: true,
        },
        tooltip: {
            trigger: 'axis',
            formatter: function (params) {
                return `<div style="color: #666;font-size: 16px;line-height: 24px">
                <span style="display:inline-block;margin-right:5px;border-radius:10px;width:8px;height:8px;background-color:${params[0]['color']};"></span>
                ${params[0]["name"]} 月费用:<span style="font-size: 16px">${params[0]["value"]}</span></div>`;
            },
            extraCssText: 'background: #fff; border-radius: 0;box-shadow: 0 0 3px rgba(0, 0, 0, 0.2);color: #333;',
        },
        xAxis: [
            {
                name: '月',
                nameTextStyle: {
                    color: '#fff'
                },
                type: 'category',
                data: dataX,
                axisTick: {
                    alignWithLabel: true,
                },
                nameTextStyle: {
                    color: '#82b0ec',
                },
                axisLine: {
                    lineStyle: {
                        color: '#82b0ec',
                    },
                },
                axisLabel: {
                    formatter: '{value}',
                    textStyle: {
                        color: '99b3d6',
                        fontSize: '16'
                    },
                },
            },
        ],
        yAxis: [
            {
                name: unit,
                nameTextStyle: {
                    color: '#fff'
                },
                type: 'value',
                axisLabel: {
                    textStyle: {
                        fontSize: '13',
                        color: '#99b3d6',
                    },
                    formatter: '{value}',
                },
                splitLine: {
                    show: true,
                    lineStyle: {
                        type: 'dashed',
                        color: 'RGBA(3, 75, 97, 0.8)',
                    },
                },
                axisLine: {
                    show: false,
                },
            },
        ],
        visualMap: {
            type: 'piecewise',
            show: false,
            dimension: 0,
            seriesIndex: 0,
            pieces: pieces
        },
        series: [
            {
                data: dataY,
                name: '', //
                smooth: false,
                type: "line",
                lineStyle: {
                    width: 1,
                    color: function (params) {
                        let color = color1[0]; // 默认为下降或相同颜色
                        if (params.dataIndex > 0 && dataY[params.dataIndex] > dataY[params.dataIndex - 1]) {
                            color = color1[1]; // 如果比前一个数据大,则为上升颜色
                        }
                        return color;
                    }
                },
                areaStyle: {},
                // areaStyle: {
                //     color: new echarts.graphic.LinearGradient(0, 0, 0, 1, [{
                //         offset: 0,
                //         color: color1[1][0] // 开始颜色,红色渐变到结束颜色透明度为0的黑色渐变效果。可以根据需要调整颜色和透明度。
                //     }, {
                //         offset: 1,
                //         color: color1[1][1] // 结束颜色,完全透明。可以根据需要调整颜色和透明度。
                //     }])
                // },
                showSymbol: true, // 隐藏折线图上的圆点
                symbol: 'circle',
                symbolSize: 7,
            }
        ],
    };

    chart.setOption(hasDataOption)
}
html:
<div ref={this.chartRef} style={{ width: '100%', height: '100%' }}></div>
