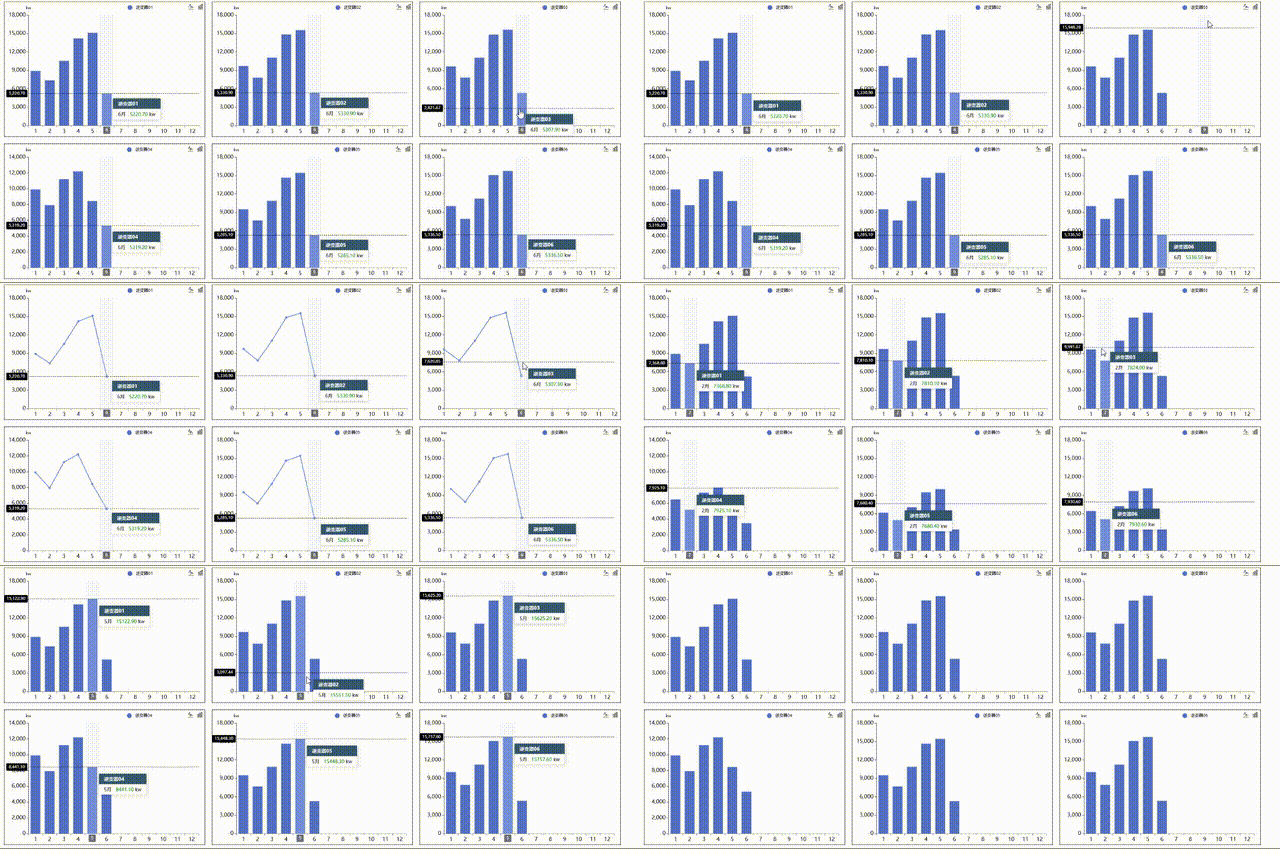
效果图:

代码实现:
import React, { Component } from 'react';
import * as echarts from 'echarts';
import moment from 'moment'
const { registerReactDom, logoutReactDom } = scriptUtil;
let style = document.createElement('style');
style.innerHTML = `
.echarts-container {
width: 100%;
height: calc(100% - 80px);
display: flex;
justify-content: flex-start;
flex-wrap: wrap;
overflow: auto;
// background:rgb(80, 202, 117);
}
.echarts-container li {
list-style: none;
margin-right: 20px;
margin-bottom: 20px;
border: 1px solid #000;
}
.echarts-container li:nth-child(3n){
margin-right: 0;
}
.echarts-container li:last-child{
margin-bottom: 0;
}
.no-data{
width: 100%;
height: 100%;
display: flex;
justify-content: center;
align-items: center;
font-size: 20px;
color: #000;
}
`;
document.head.appendChild(style);
class CustomComp extends Component {
state = {
data: {},
xData: [1, 2, 3, 4, 5, 6, 7, 8, 9, 10, 11, 12],
chartInstances: {},
currentHighlightIndex: null,
chartType: 'bar' // 图表类型状态
}
componentDidMount = () => {
registerReactDom(this, this.props);
}
componentWillUnmount() {
logoutReactDom(this, this.props);
}
componentDidUpdate(prevProps, prevState) {
if (prevState.currentHighlightIndex !== this.state.currentHighlightIndex) {
this.highlightCharts(this.state.currentHighlightIndex);
}
if (prevState.chartType !== this.state.chartType) {
this.updateAllCharts();
}
}
// 数据初始化
init = (data) => {
let newData = _.groupBy(data, 'pn'); // 按pn分组
/* 示例数据:
{"B80005210603181143": [{dataDate:"2025-01", valSUM: 124829},...],
"B80005210603195057": [{dataDate:"2025-01", valSUM: 124829},...]}
*/
// console.log(newData, 'newData');
this.setState({
data: newData
})
Object.keys(newData).forEach((key) => {
let obj = newData[key];
let yData = [];
obj.forEach((item) => {
yData.push(item.valSUM);
})
this.chartInit('analysis' + key, yData, obj[0].deviceName, key);
})
}
// 图表初始化
chartInit = (id, yData, name, key) => {
let { xData, chartType } = this.state;
let myChart = echarts.init(document.getElementById(id));
var option = {
backgroundColor: 'transparent',
tooltip: {
trigger: 'axis',
axisPointer: {
type: 'cross',
// type: 'none',
crossStyle: {
color: '#000'
}
},
// 添加事件监听器
showContent: true,
formatter: params => {
let index = params[0].dataIndex;
let month = xData[index];
let value = params[0].value.toFixed(2);
let seriesName = params[0].seriesName;
this.setState({ currentHighlightIndex: index });
// return params[0].seriesName + '<br/>' + xData[index] + '月: ' + params[0].value.toFixed(2) + 'kw';
return `
<div style="background-color: #37586d; color: #fff; padding: 5px 15px; border-radius: 2px; line-height: 1.5;">
<strong style="color: #fff; font-size: 14px;">${seriesName}</strong><br/>
</div>
<div style="background-color: #fff; color: #000; padding: 5px 15px; border-radius: 2px; line-height: 1.5;">
<span style="color: #000;">${month}月 </span><span style="color: green;"> ${value}</span> kw
</div>
`;
},
// 允许使用 HTML 内容
useHTML: true,
// 可选:设置 tooltip 的样式
extraCssText: 'background-color: #37586d; color: #fff; padding: 0px 0px; border-radius: 2px; line-height: 1.5;border:none;'
},
grid: {
top: '10%',
right: '3%',
left: '12%',
bottom: '8%'
},
// 工具配置
toolbox: {
feature: {
dataView: { show: false, readOnly: false },
magicType: { show: true, type: ['line', 'bar'] },
restore: { show: false },
saveAsImage: { show: false }
},
iconStyle: {
borderColor: "#000", // 图标默认颜色
},
emphasis: {
iconStyle: {
borderColor: "#000", // 图标hover颜色
},
},
},
legend: {
data: [name],
type: 'scroll',
icon: 'circle',
top: 5,
right: 150,
textStyle: {
color: '#000',
margin: '10',
},
},
xAxis: [
{
type: 'category',
data: xData,
axisPointer: {
type: 'shadow'
},
axisLabel: {
margin: 10,
color: '#000',
textStyle: {
fontSize: 16
},
},
}
],
yAxis: [
{
type: 'value',
name: "kw",
nameTextStyle: {//y轴上方单位的颜色
color: '#000'
},
splitLine: { show: false },
axisLabel: {
formatter: '{value}',
color: '#000',
fontSize: 16
},
axisLine: { // 添加y轴轴线
show: true,
lineStyle: {
color: '#000' // 轴线颜色
}
},
axisTick: { // 添加y轴刻度
show: true,
lineStyle: {
color: '#000' // 刻度颜色
}
}
}
],
series: [
{
name: name,
type: chartType,
// barWidth: '15%',
// itemStyle:{
// color: '#DAC8A3'
// },
data: yData
},
]
};
myChart.setOption(option, true)
// 保存图表实例
this.setState(prevState => ({
chartInstances: {
...prevState.chartInstances,
[key]: myChart
}
}));
// 添加事件监听器
myChart.on('mouseover', (params) => {
this.setState({ currentHighlightIndex: params.dataIndex });
});
myChart.on('mouseout', () => {
this.setState({ currentHighlightIndex: null });
});
// 图表类型切换
myChart.on('magictypechanged', (params) => {
this.setState({ chartType: params.currentType });
});
}
// 高亮图表
highlightCharts(index) {
const { chartInstances } = this.state;
Object.keys(chartInstances).forEach(key => {
let chart = chartInstances[key];
// 隐藏所有tooltip
// chart.dispatchAction({
// type: 'hideTip'
// });
// // 取消高亮所有柱子
// chart.dispatchAction({
// type: 'downplay'
// });
// 包含清除tooltip、柱子高亮、坐标轴指示器
chart.dispatchAction({
type: 'updateAxisPointer',
xAxisIndex: 0, // 对应你的 x 轴索引
yAxisIndex: 0, // 对应你的 y 轴索引
tooltip: {
show: false // 强制隐藏指示器
}
});
// 完全重置图表状态,如果有图表类型切换,会被重置
// chart.dispatchAction({
// type: 'restore'
// });
});
// 高亮图表
if (index !== null) {
Object.keys(chartInstances).forEach(key => {
let chart = chartInstances[key];
// 触发tooltip显示
chart.dispatchAction({
type: 'showTip',
seriesIndex: 0,
dataIndex: index
});
// 高亮柱子
chart.dispatchAction({
type: 'highlight',
seriesIndex: 0,
dataIndex: index
});
});
}
}
// 切换图表类型
updateAllCharts = () => {
const { chartInstances, chartType } = this.state;
Object.keys(chartInstances).forEach(key => {
let chart = chartInstances[key];
let option = chart.getOption();
option.series[0].type = chartType;
chart.setOption(option);
});
};
render() {
const { data } = this.state;
return (
<ul className='echarts-container'>
{Object.keys(data).length > 0 ?
Object.keys(data).map((key) => {
return (
<li id={'analysis' + key} style={{ width: '31%', height: '400px', backgroundColor: 'transparent' }} > </li>
)
}) :
<div className='no-data'>未查询到数据</div>
}
</ul>
);
}
}
export default CustomComp;